Graphical Report- Subjectwise Performance
Exam results or test reports show how students have fared in the exams. While tabular test reports do just that, graphical performance reports show where the students stand in their class or amongst their peers. However, creating such reports can be time taking. But it need not be so if you are using the Addmen OMR software.
The OMR software has a special feature that generates graphical performance report automatically. Apart from this, several types of graphical reports can be created using this software according to your needs.
Overall performance report: Here you can view an overall performance report where total marks as well as section-wise or subject wise scores are projected.
- This report presents the marks in the form of pie diagrams and bar graphs.
- The first section shows distribution of total questions in the test in the form of pie diagrams. The first pie diagram consists of count of questions, the second one has marks of questions and the third one has the score of the students. Each section is distributed according to the subject.
- The last pie diagram represents the correct, incorrect and questions that were left by the candidate.
- This is followed by a bar graph where the candidate's score is compared with that of the toppers. The first bar stands for the candidate's score (blue), the second one is the average score (red), the third is the top score or rank one (green), the fourth is rank two (orange), the fifth is rank 3 (yellow), the sixth is rank 4 (purple) and the seventh is rank 5 (indigo).
- The last bar graph compares the marks scored by the candidate in each subject with that of the first five toppers.
- The scores in Physics, Chemistry and Maths are compared here. The test marks are provided in tabular format, along with the marks of the top scorers.
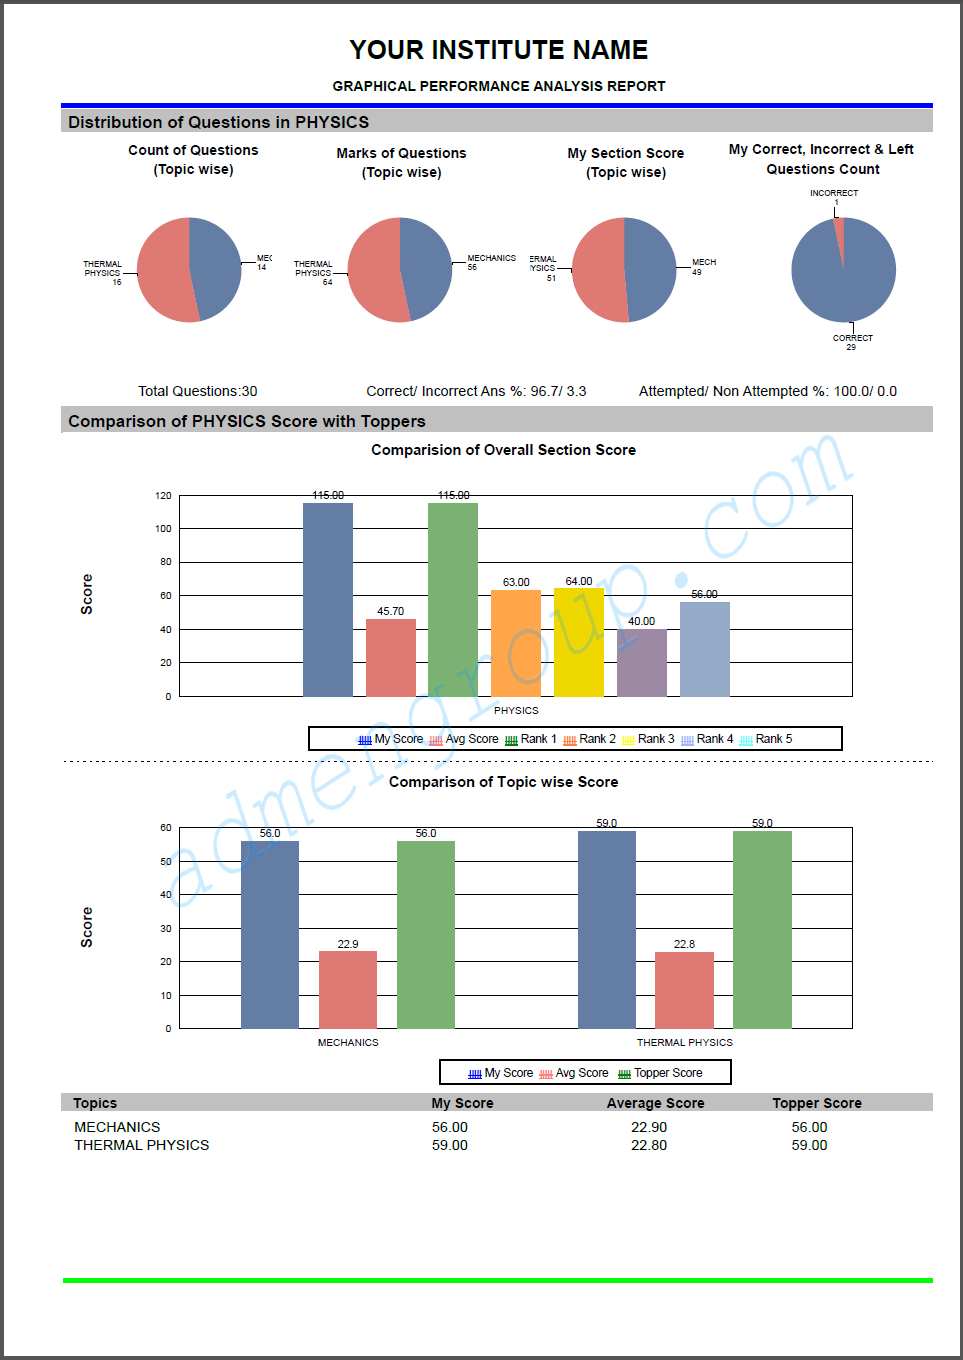
Subject-wise performance report: Here we will take a look at subject-wise performance report. Subject-wise performance report means that you get a separate performance report for every subject in the exam. We present three graphical reports, each report dedicated to one subject. While the marks in each report are different, the structure of each of them is the same.
- The first one provides the graphical report of Physics test, the second one shows the performance report of Chemistry test and the third one is that of Maths exam.
- In the first section of all the three reports, the test details are provided in the form of pie diagrams. The first pie diagram shows distribution of questions in every subject. The second pie diagram shows how the marks are distributed amongst the topics. The third section shows the marks scored by the student in each topic and the fourth one shows the count of correct, incorrect and left questions by the student.
- In the next section, the scores are provided in comparison to the toppers in the class in the form of bar diagram. The first bar shows the marks that the student has scored in the subject. This is followed by average score, first rank, second rank, third rank, fourth rank and fifth rank. The colors that represent each rank are described below the diagram for easy recognition.
- This is followed by another bar diagram that shows the marks received for every topic. The student's marks for each topic are compared with that of the average score and top score. These marks are presented in tabular format too.
With the subject-wise representation of marks, students will be able to know how they have fared in all the subjects individually. They will know as to which subject needs more preparation for future tests or exams.
|