Online Test Result Graphical Report Description
The OMR software by Addmen provides the facility of generating reports after processing the scanned OMR sheets. These results can be uploaded on the institutes's website for the students to view it. The results are available in the form of mark lists, tabular format, PDF format and graphical format too. The online test graphical result is a report that provides minute details of the individual's performance during the test.
Features of graphical report format
Here, you can take a look at some of the key features of online test result graphical report description.
- The graphical report shows the current test scores of the individuals in comparison with the scores of the past tests, marks achieved in every section of the current test, scores received in every topic in the current test, scores as per the difficulty level of questions, and marks achieved in overall current test.
- These comparisons are shown in the form of pie charts, line graphs, bar graphs, etc.
- It is possible to view the overall performance growth of an individual with the help of a line graph. This contains the student's score in comparison to that of the average scorer, top scorer and minimum scorer. This is a great way of showing the student's growth rate.
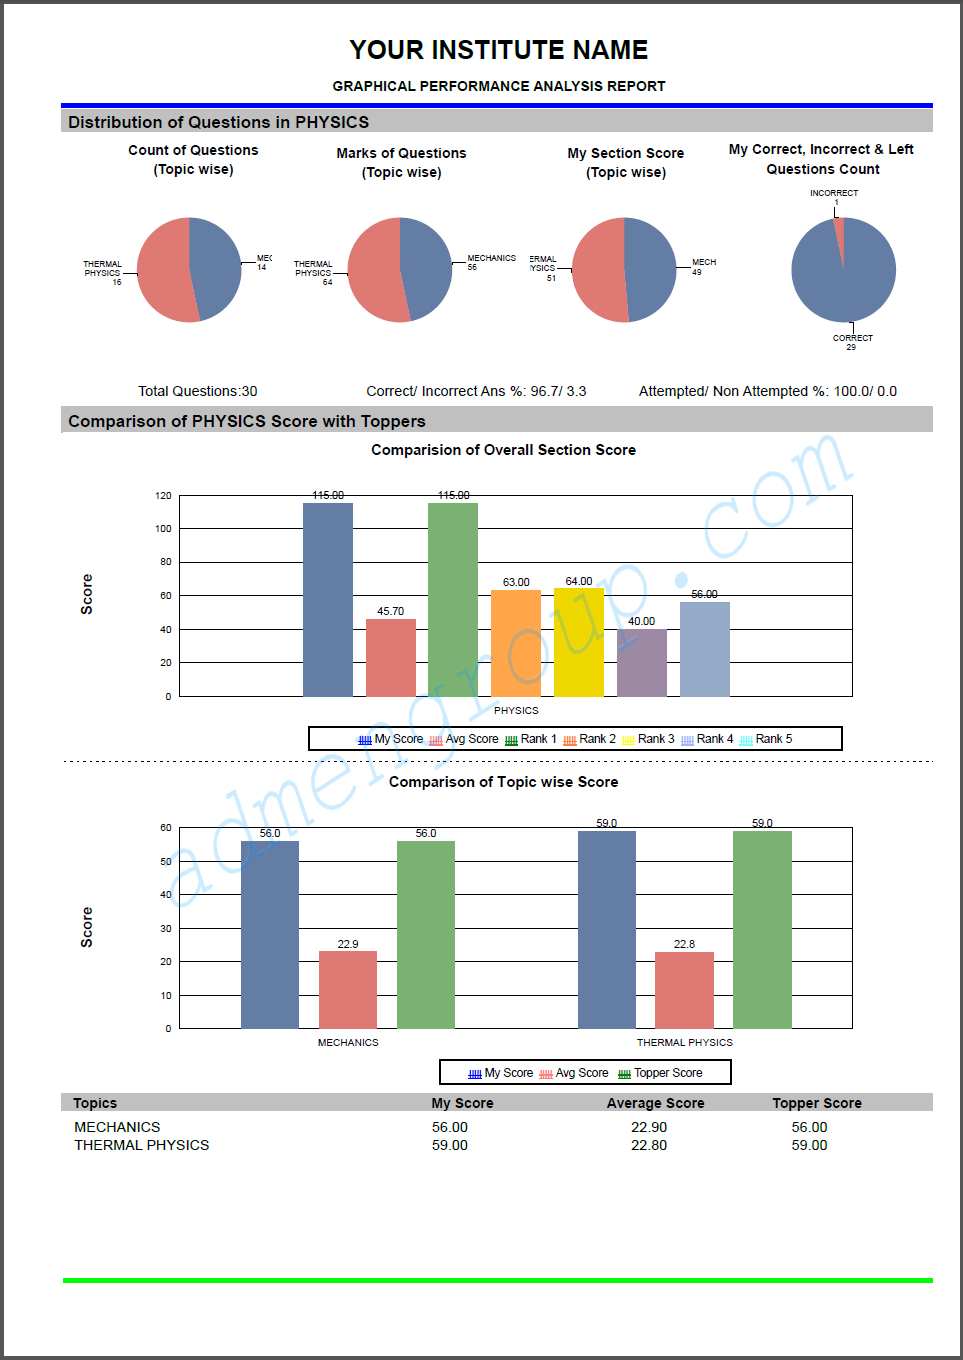
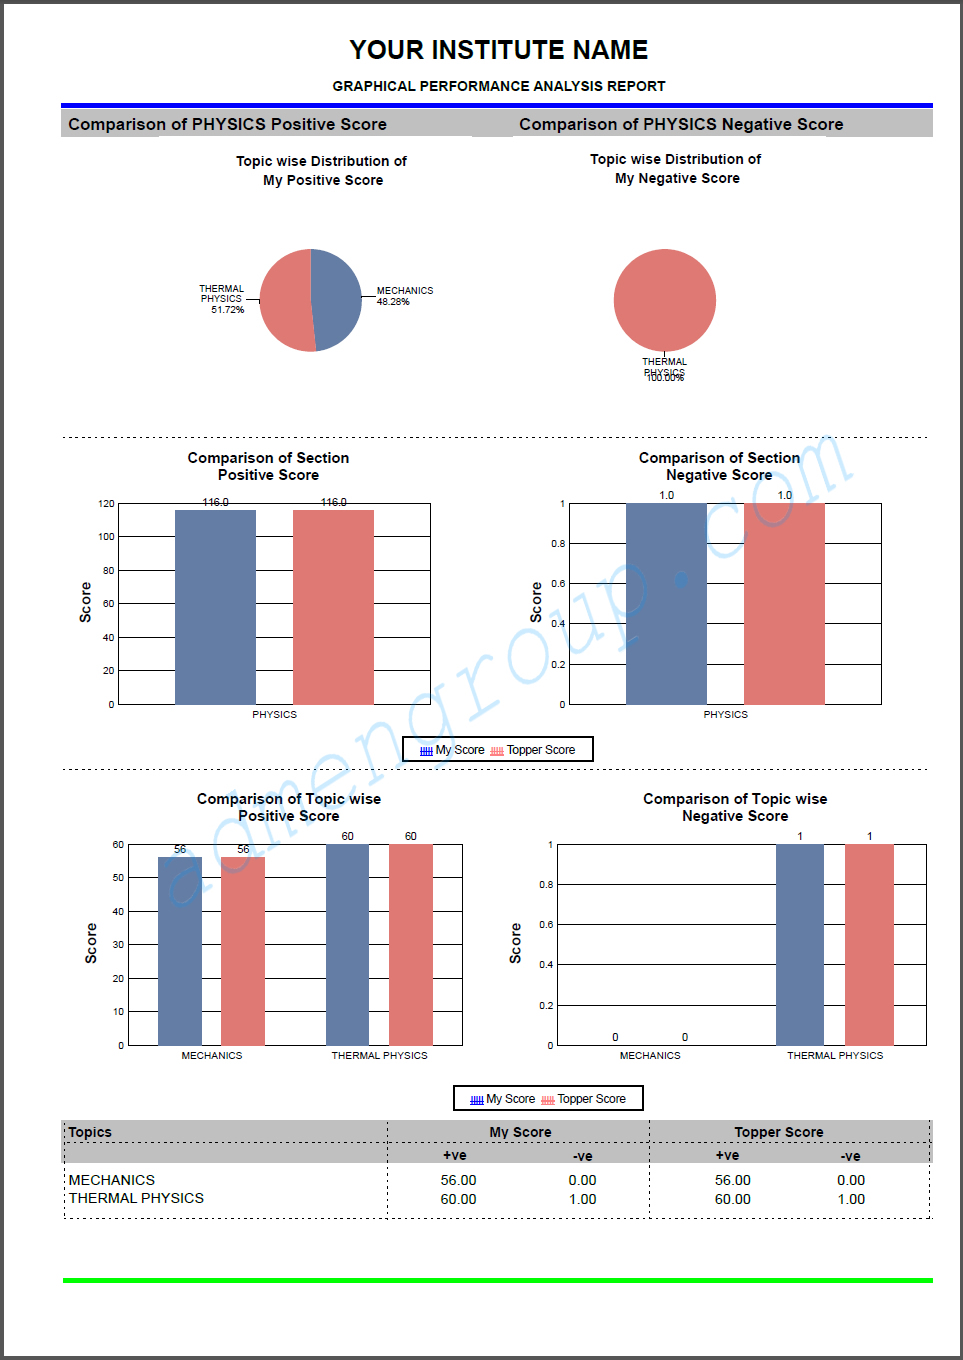
- A pie chart is used to show the distribution of questions amongst every section of the paper. Apart from this, there are several pie charts that display the marks allotted for every question, marks allotted to the questions attempted by the student, marks obtained by the students in different sections and the negative marks scored by the student in each section.
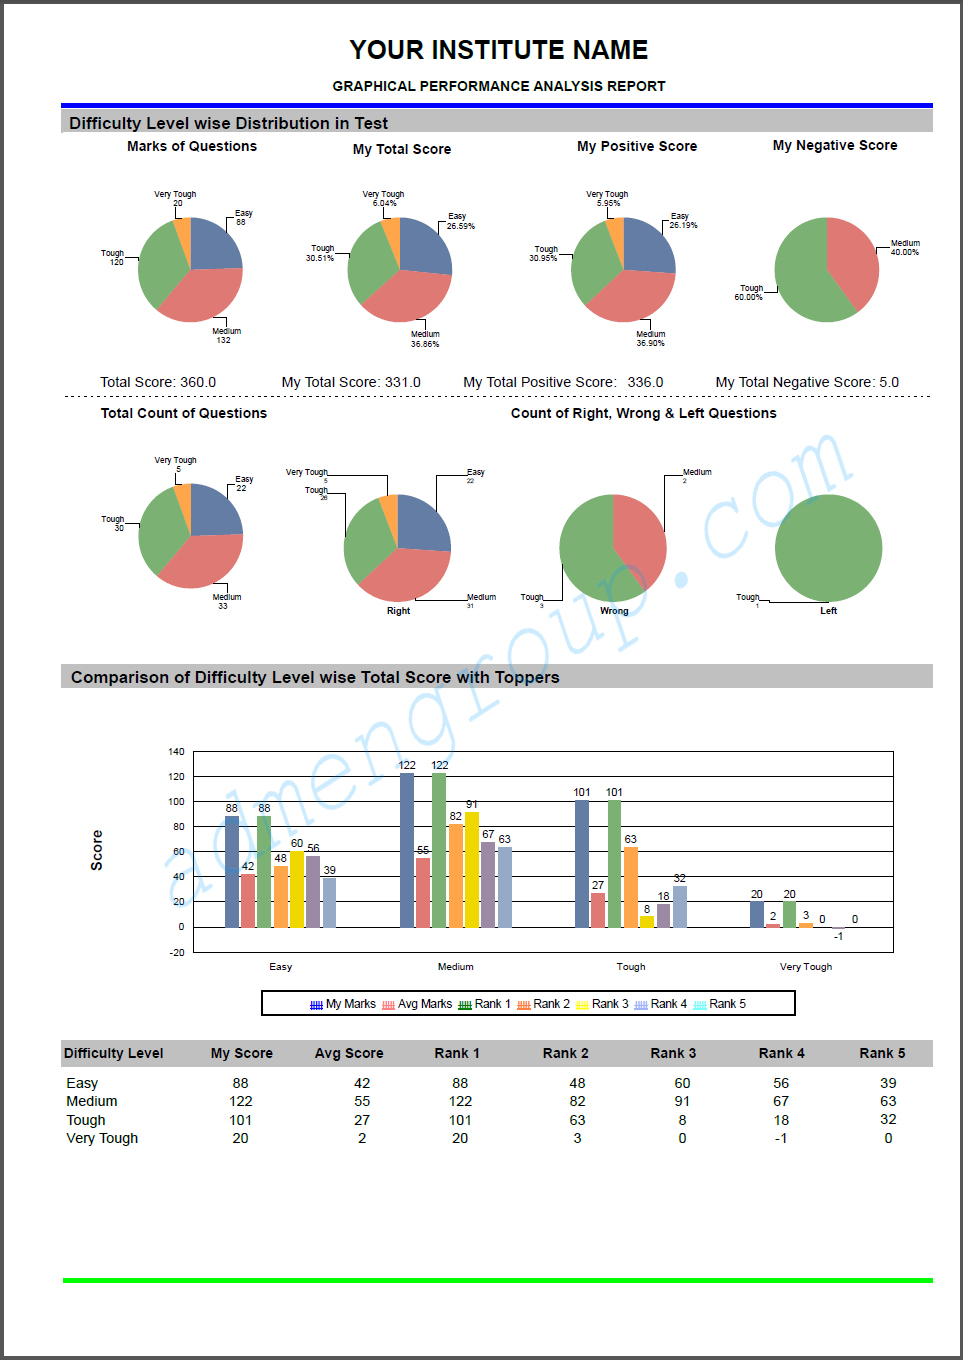
- A pie chart displaying distribution of questions as per difficulty level is also a part of the online test result graphical report. Here, you can find the number of questions divided as per their difficulty levels, which include very easy, easy, average, difficult and very difficult. You can also find the marks scored by the student in the questions of each difficulty level.
- The graphical report also includes a graph that depicts the score of the individual compared to the top five scorers. You will also find topic-wise score performance of the student in comparison to five toppers.
- Apart from the above given ones, there are many other graphical representations found in the test reports. Some of these include performance graph according to the number of questions attempted, line graph that illustrates the growth of the individual over several tests, count of the number of questions attempted, incorrect, correct and not attempted, etc.
Online test result graphical report description is useful for the students to know where they stand, how they have improved and how much more they have to improve.
|